- Panasonic Blog
- 2 mins
Digital manufacturing’s intent is improved quality, increased flexibility and reduced costs but the actual collection, visualization, and analysis of all the data that’s produced has become one of the greatest manufacturing challenges.
Do you remember when data was predictable?
It seems like only yesterday that manufacturing data was easier to get your arms around. Managers could coordinate data collection based on pre-set production schedules and metrics that included machine productivity, shift assignment, and inventory levels.
Simply put, our production systems used to be based on “build it and they will come.”
Products used to go into production based on when they were planned for release. A batch of the exact same model was held in finished goods inventory waiting for a customer to purchase. And ERP and MES systems data were tied to the supply chain data in a cadence set by those planned manufacturing schedules. For many businesses…those days are over.
Welcome to the realities of demand-driven, just-in-sequence manufacturing data
In today’s world of on-demand customized manufacturing there is much more data to capture, visualize and analyze at every point in the process and it’s more essential than ever for making accurate decisions. Customers ordering specific styles or versions of products requires machine, part, and staffing changes on the fly. Data visualization and analysis must happen much faster than ever before. The greater efficiency and less waste that just-in-sequence manufacturing promises can only be achieved when all the new data on the manufacturing floor can be accurately seen and effectively acted upon in real-time.
White boards aren’t enough anymore
Communication boards with written tallies and hourly totals can’t keep up to provide accurate visualization. Even manual entry into spreadsheet reports, graphs, and charts can’t provide real-time data visualization. And if visualization tools can’t keep up, then managers won’t be able to analyze it to make the needed changes that assure accurate, quality, on time production.
Manufacturing data is a whole lot of “What.”
Real-time visualization and analytics adds the valuable “Why.”
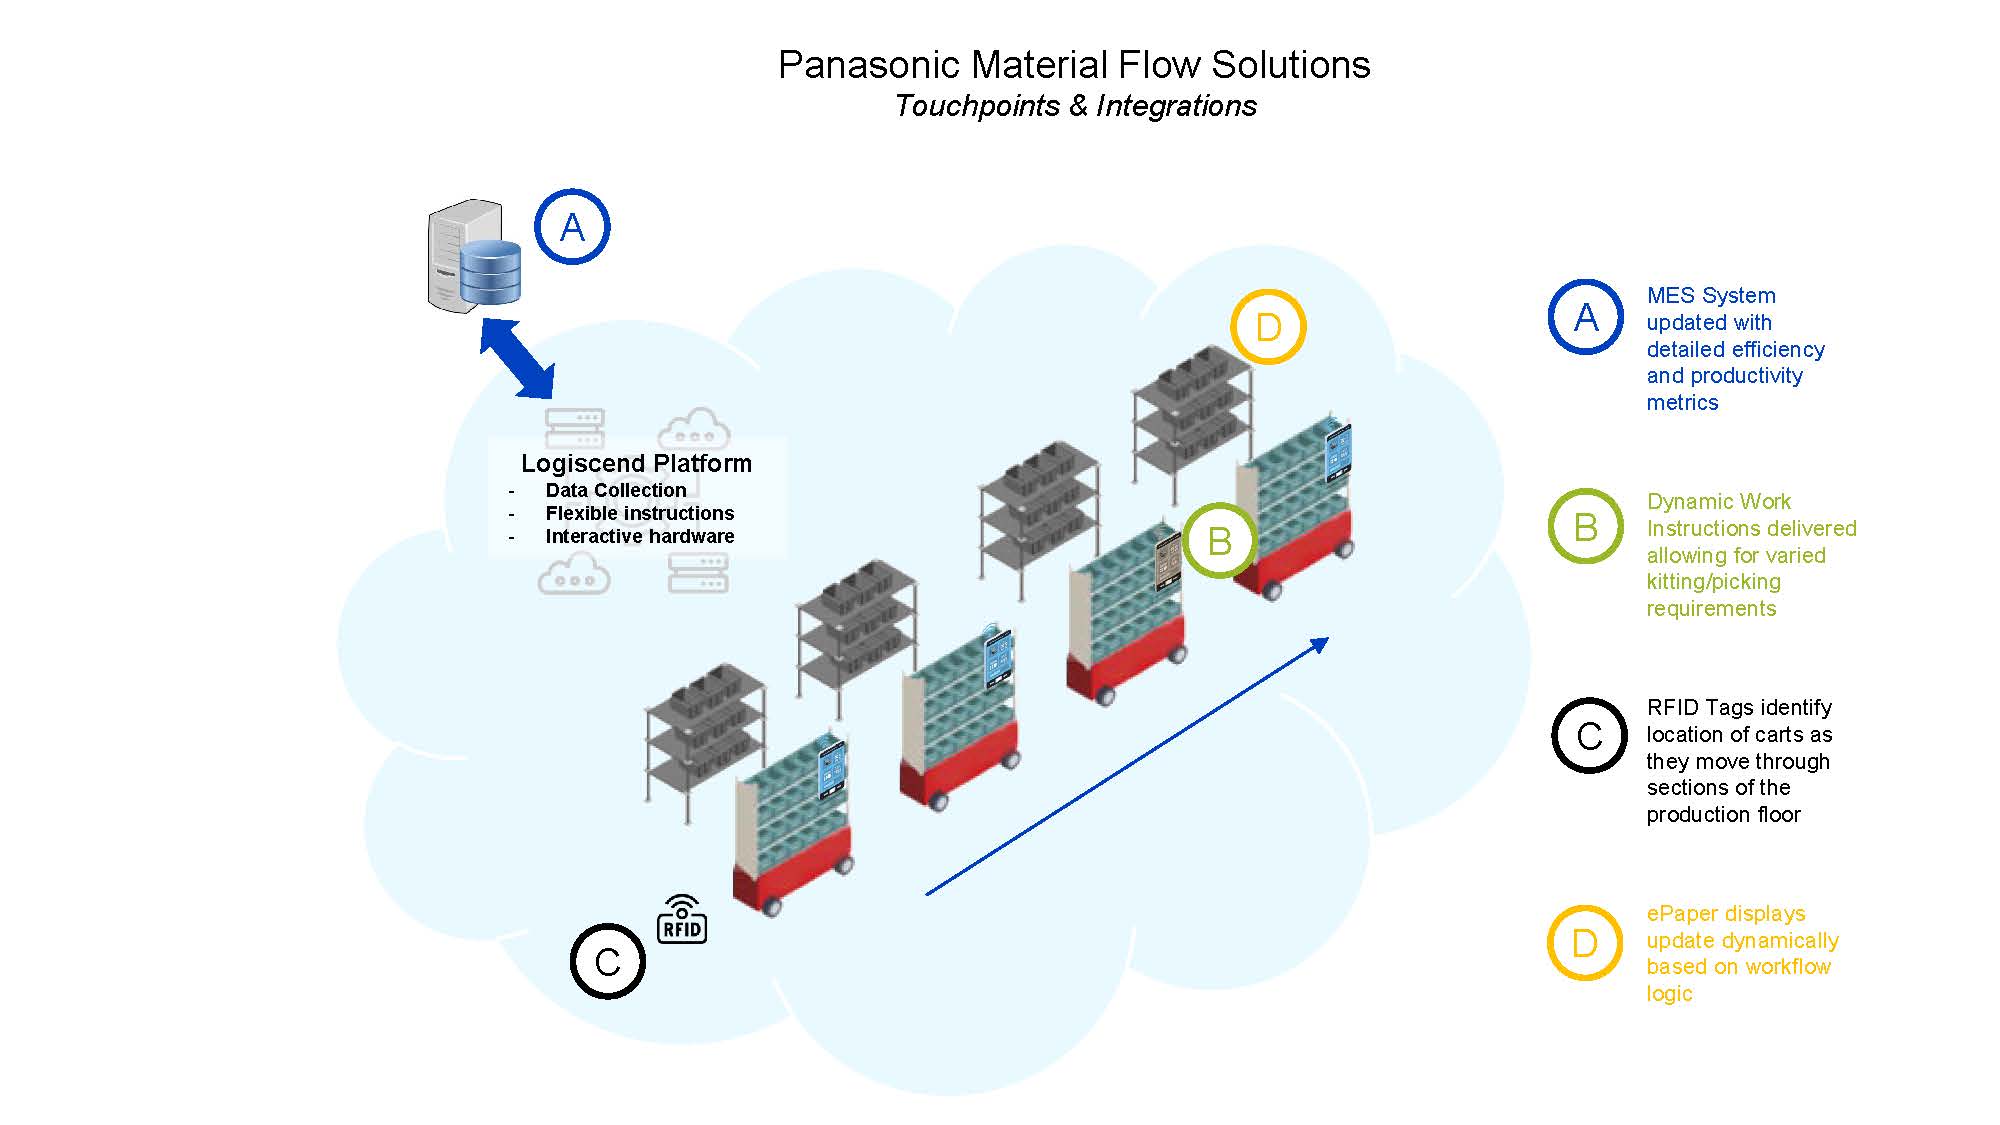
That’s exactly what the Panasonic Logiscend InSights Software platform delivers.
The Logiscend Asset Tracking Software provides real-time traceability, visibility and two-way communication driven control of all your important assets that move throughout a Manufacturing facility. This real-time location information can be categorized and monitored in configurable customer dashboards.
You can use InSights Software to maximize efficiency and improve operational processes by looking at your material flow data over time and assessing performance across shifts, areas, people and plants.
InSights Software sees inside all your key manufacturing processes:
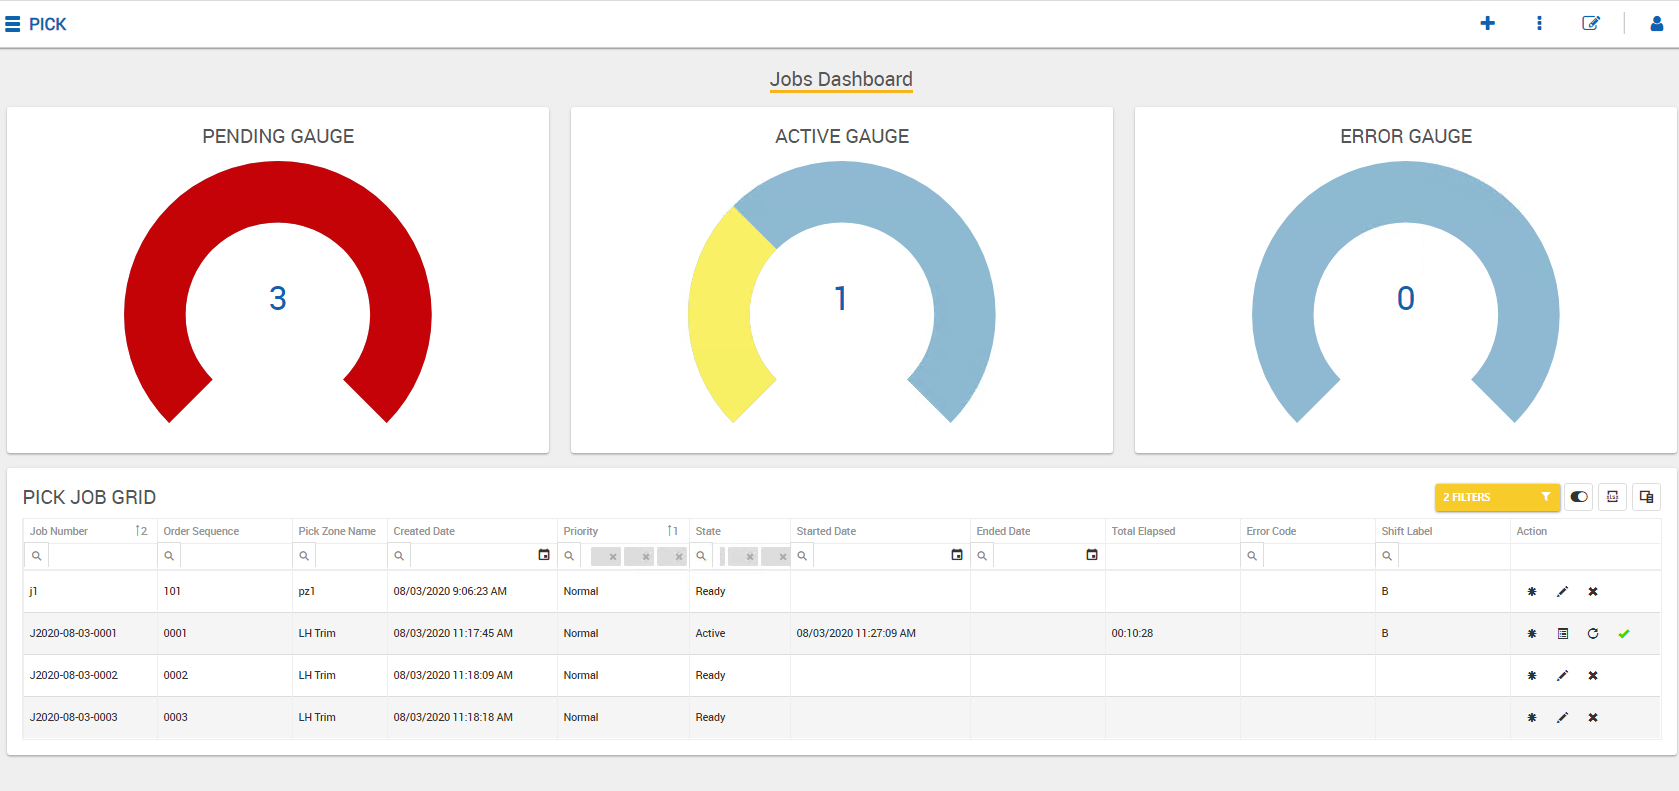
- For picking operations intelligent manager dashboards in Logiscend help reveal needed action in real time and the software seamlessly integrates with your ERP/MES systems helps you use this information to increase efficiency and reduce costs. Insights Software can then aggregate this captured data over selectable periods of time to identify key trends and potential areas of improvement.
- For replenishing operations, the dashboards can reveal outstanding parts to be delivered and delivery times over threshold, and visualization tools plot trend data so operator performance, part location and driver routes can be optimized.
- For tracking containers, manager dashboards include a floor map showing location and availability with data to track usage, maintenance schedules, and cycle time and process step tracking ensures timely delivery with an audit trail of maintenance records and certifications.
The truth is, the improved efficiency, lower costs and reduced inventories that industrial IoT promises can only be fully realized when all the data generated is effectively gathered, visualized and analyzed.
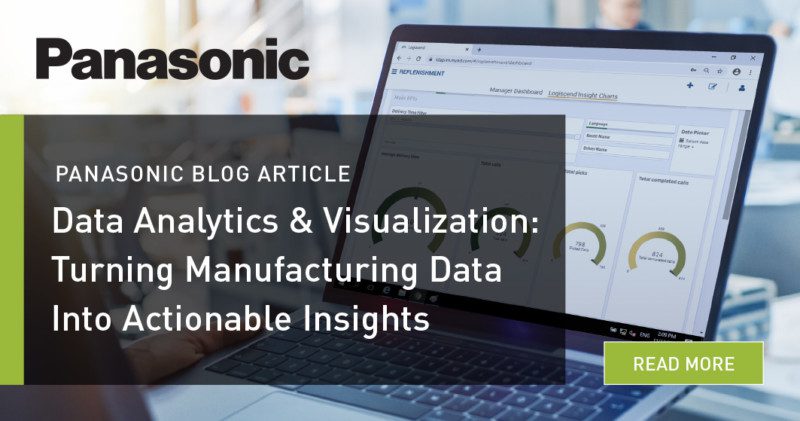
Learn more about all the Logiscend data visualization and analytics solutions right here.